Exploring two Text Fields
- Please continue with the superhero data set from the previous classes.
- I would like to explore the Gender field.
- Make a new worksheet called gender.
- Provide an appropriate comment in the first cell.
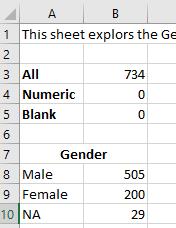
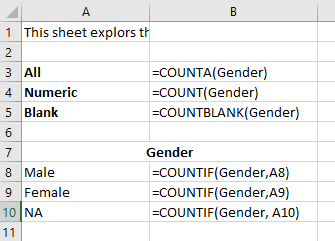
- Perform the basic counts
- All data
- Numeric data
- Blank cells
- We can't really do a five number summary.
- So we will probably have to be content just examining the different values.
- Do an advance filter to select unique values for gender.
- We can't use the range name,
- the advanced filter will treat the first entry as a header regardless
- And the name range function does not include the header.
- So just select the range by hand.
- We will probably want to replace the - fields with an NA for consistency.
- Let's add a count for each gender type.
- countif
-
-
- Perhaps add a total line to the gender counts to make sure that the count is the same.
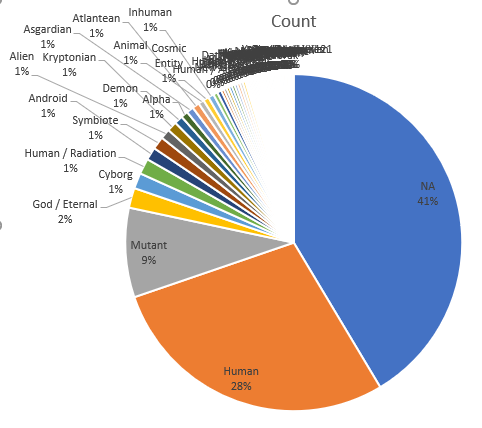
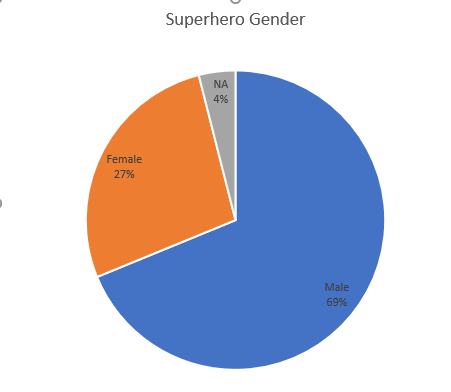
- A pie chart (or circle graph) might be appropriate here.
- Select the three genders
- DO NOT SELECT THE TOTAL LINE
- Insert a pie chart.
- Note the Quick Layout on the Design tab for some suggested layouts.
-
- There is not much else you can do with this data right now.
- You could build some different charts, (bar, column, ...)
- What comments could you make about the findings here?
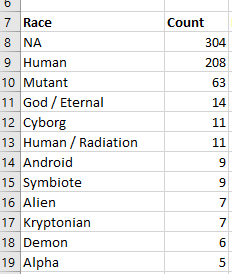
- Let's explore the race field
- New Worksheet, comment, count
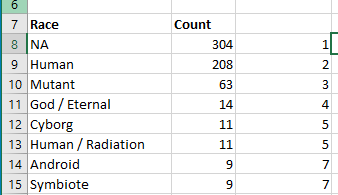
- Extract the unique races
- Remember you need to select the range, you can't use the name.
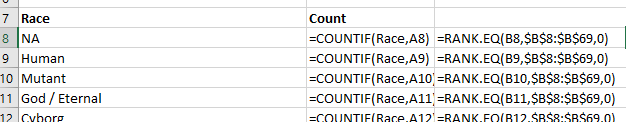
- Countif to count the occurrences.
- Sort by occurrence, high to low, then by race A-Z
-
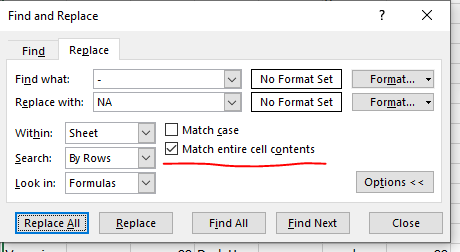
- Replace - with NA
- Look at "Demi-God", why did it drop to 0?
- Undo that.
- Fortunately Replace has a "Match entire cell contents"
-
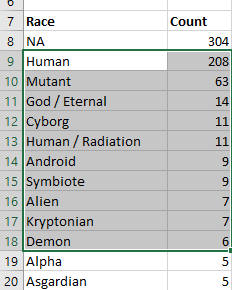
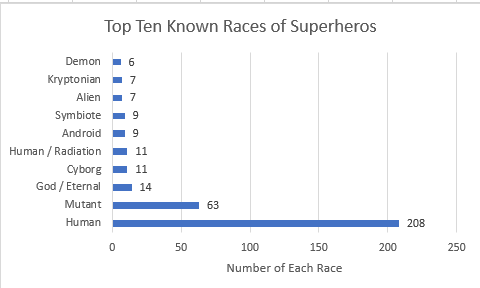
- There are too many to draw a pie chart, it would just look silly.
- Let's draw just select the top ten known species
-
- Then see what excel recommends
- Select Recommended Charts
-
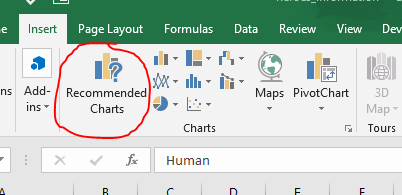
- The clustered bar chart looks like a good thing.
- Select this
- Add data labels
- Add a reasonable title.
- Add a horizontal axis title
-
- Rank.EQ
- Some times it is nice to know the position or rank of an item.
- It ranks the data
- If there is a tie, the top rank is returned.
- IT takes
- The number you want to know the rank of
- The list of items it is ranked out of.
- A direction flag.
- Let's rank the highest value as number 1 (use a 0 as the third parameter.)
-
-
- Documentation on Rank
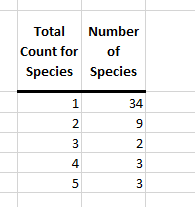
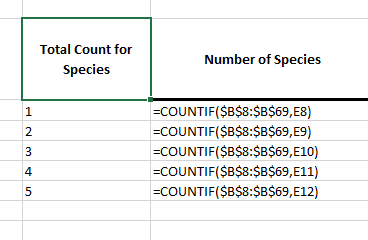
- Let's count the species with few representatives
- In cell E7 put Total Count for Species
- In cell F7 Put Number of Species
- Bold, center, lower border.
- In E8 through E12 put 1 - 5
- Count to number of occurrences for each low represented species
-
-
- What could we say about race in the documentation.