CSCI 104 Spring 2017, Final Exam, Practical Portion
You should perform all computations using excel.
Unless otherwise specified the exact appearance of the document does not have to match the example below, but all of the elements must be in place.
You may ask for help, but I may not provide that help. You may use your notes, book and my on line notes if you wish.
If you get stuck on a portion of the test, move on. Complete what you can.
Please be aware that the dropbox folder will close at 12:20 for the 12:30 class and 2:35 for the 3:30 am class. There are penalties associated with late or incorrectly submitted tests.
As you complete a section, you might consider uploading the file from that section to avoid last minute problems.
You may use your books, notes and the internet to do this portion of the test. You may not communicate with another person while working on this portion of the test.
- Excel Portion
- Download and save this document. Open the document in excel and complete the following tasks.
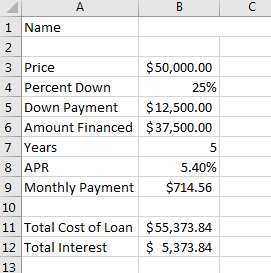
- Go to the Start worksheet. Use computations to calculate the cost of a $50,000 car financed for 5 years at 5.4% interest. The loan requires a 25% down payment.
- Place your name in cell B1.
- [1 point] In cell B5 compute the down payment.
- [1 point] In cell B6 compute the amount financed.
- [5 point] In cell B9 compute the monthly payment.
- [1 point] In cell B11 compute the total amount paid for the car.
- [1 point] In cell B12 compute the total interest paid for the car.
-
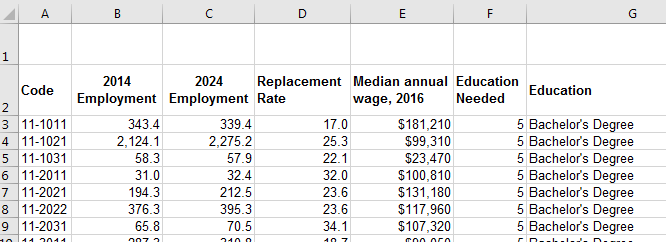
- Go to the JobOpening worksheet. Use computations to perform the following steps. When finished, all information should be computed for all rows in the table.
- This worksheet contains employment data from 2014 along with employment predictions for 2024. The Code column matches the Code column in the Occupation Names worksheet. Current employment levels for the listed jobs are given in column B. Predicted employment levels for the jobs are listed in column C. Column D contains the estimated rate at which workers in a given job will need to be replaced. Column F contains a code which matches degree levels in the Sub Tables worksheet. This data is from the Bureau of Labor Statistics web cite.
- [3 points] Column F contains a number which represents the type of degree needed for each job.
- Using this number and the Degree Table on the Sub Tables workbook, place the appropriate degree required in column G.
-
- [1 points] Compute the expected job growth in column H by subtracting the employment in 2014 (column B) from the expected employment in 2024 (column C).
- [1 points] Compute the expected replacement requirement in column I by multiplying the 2014 employment rate (column B) by the replacement rate (column D). The Replacement Rate is not expressed as a percentage so you will need to divide by 100 to achieve the proper results.
- [1 points] In column J, place the sum of the value calculated in column H and column I.
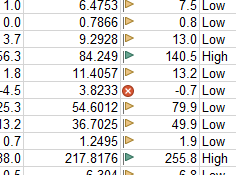
- [4 points] Based on the result in Column j, place the word Low In column K if the expected number of job openings is less than 100 and the word High if the expected number of job openings in greater than or equal to 100.
- Hint: The secondary sort is better if you sort on column F not column G.
-
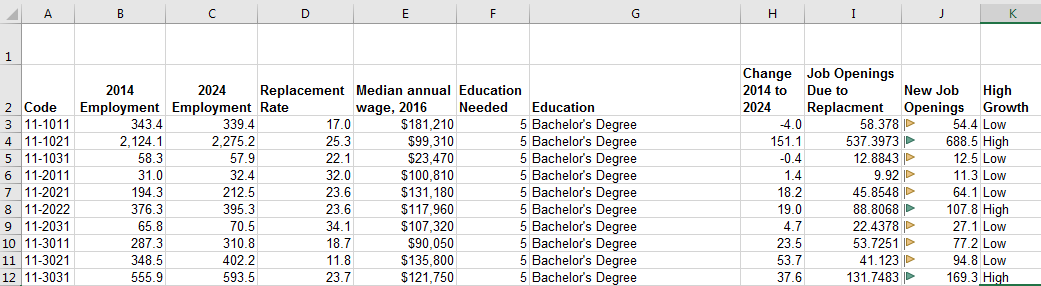
- [4 points] Format the data values in column J so that a green flag appears if the expected number of new jobs (column J) is greater than or equal to 100, a yellow flag if the expected number is positive but less than 100 and a red circle with an x if the expected number is negative.
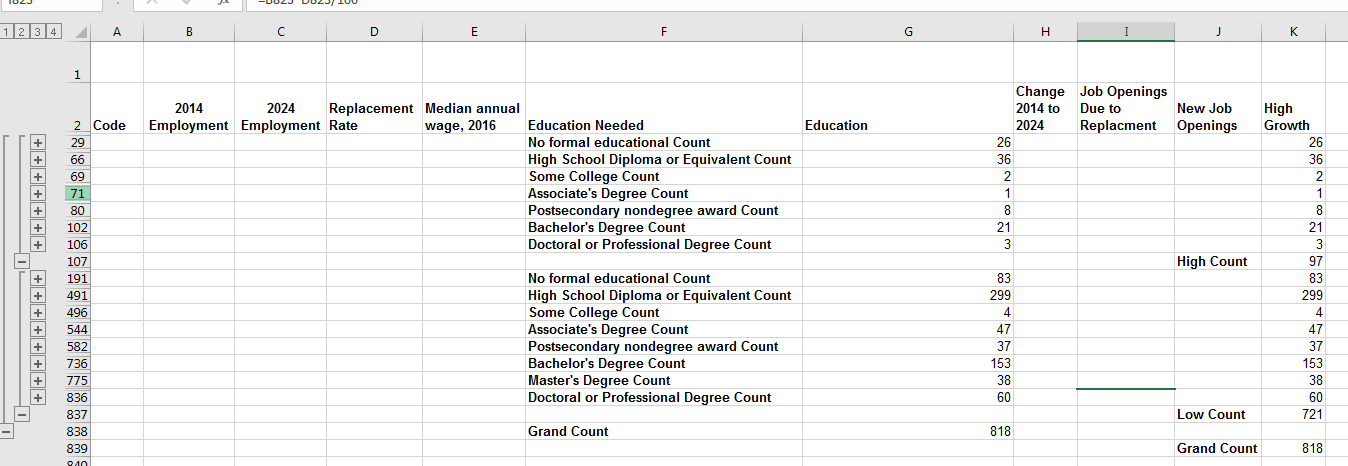
- [6 points] Using the data in this workbook, produce a summary of the number of high growth and low growth jobs by degree. You should do this using a tool but not a pivot table. Your results should be similar to the following image.
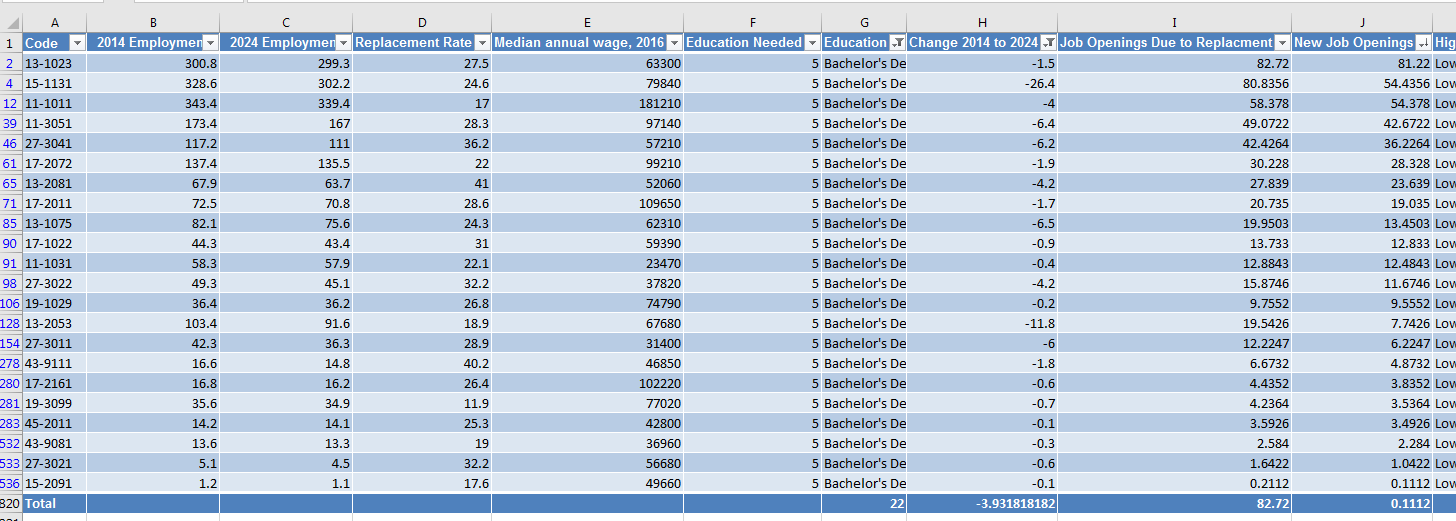
- [6 points] Go to the Job Data worksheet. This worksheet contains a static copy of the Job Opening worksheet.
- Using the table tool, insert a table containing this data.
- Filter the table to display only Bachelor's Degrees with a negative change from 2014 to 2024.
- Sort this table by New Job Openings, largest to smallest.
- Using the Proper Tool identify
- The number of jobs in this table.
- The average change from 2014 to 2024
- The Maximum number of Job Openings due to Replacement
- The Minimum number of new Job Openings.
-
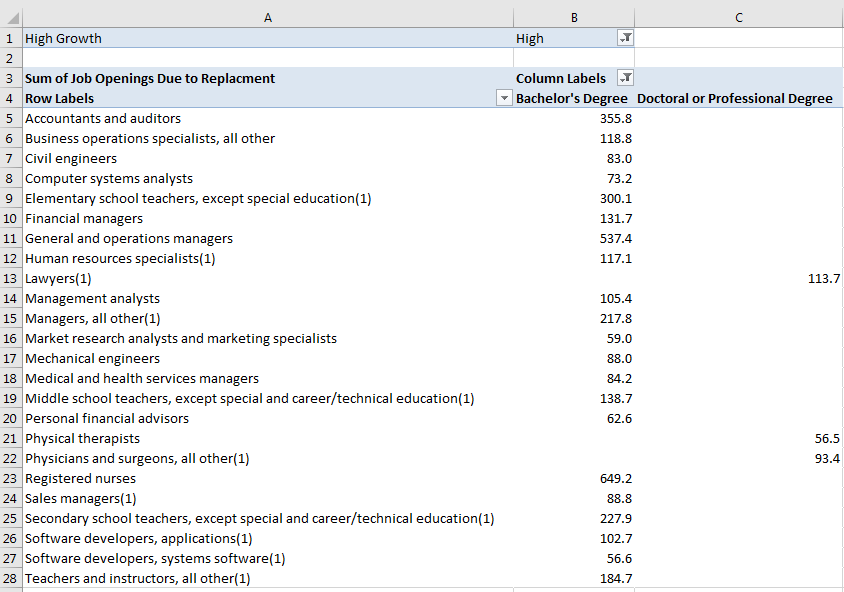
- Using information on the Job Data worksheet and the Occupation Names worksheet
- [3 points] Build a relationship between these two data sets based on the Code columns.
- [2 points] Build a pivot table that employs both of these tables.
- [5 points] The pivot table should show
- Job Descriptions in the column headings.
- Degrees required in the row headings, but only show results for Bachelor's and Doctoral degrees.
- The sum of Job Openings Due to replacement, formatted to one decimal place.
- Filtered to only show "High" growth jobs.
- Without grand totals.
-
- [3 points] Using the pivot table, build a Pivot chart.
- Display as a column chart.
- Add the data for Associate's Degrees.
-
- Word Portion
- Download this document.
- Insert a cover page using the "Integral" style.
- Change the image to be the LBS logo.
- Change the title to be "The Bureau of Labor Statistics"
- Make sure you are listed as the author.
- Change the abstract to be "A report for CS CI 104"
-

- [4 points] There are two sources listed on the first page
- Add these to the citation manager.
- Remove the citation information from the text of the document.
- [4 points] Insert a citation to
- Johnson ET AL. at the end of the first paragraph
- Cohen at the end of the second paragraph.
- Add a bibliography on a new page at the end of the document.
- On a page which can contain a style of page number different from the text of the document.
- In MLA style.
- Contain the page number I
- Built so that if the bib were to go over a single page, the page number would increment automatically.
-

- My final word document:
- PowerPoint Portion
- Start with the default (Blank Presentation) PowerPoint presentation.
- [5 points] Modify the presentation so that all titles are
- Right justified.
- 50 point font
- Red
- Underlined
- With a star in the left hand corner.
-
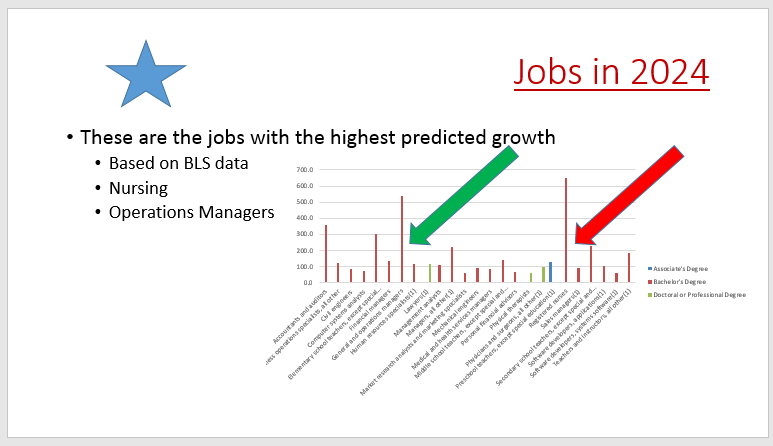
- Add a title slide
- Add a regular slide
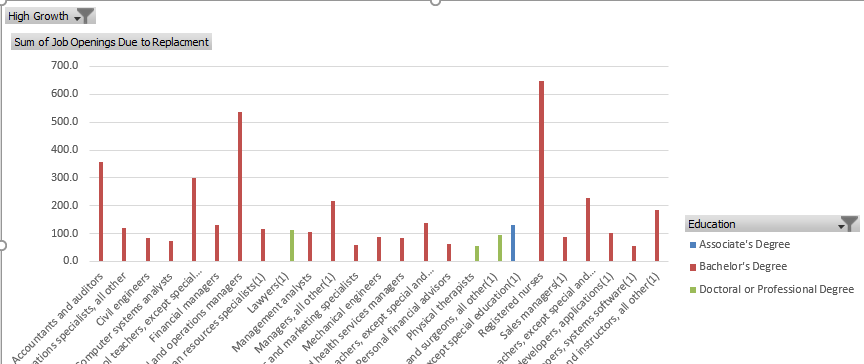
- Match the image below.
- [3 points] The text should be animated to appear one line at at time on click.
- [2 points] The image should be the pivot chart from excel.
- This image should appear with the second bullet point (Based on BLS data)
- [2 points] The red arrow pointing to Registered nurses should appear with the text Nursing.
- [1 point] The red arrow should disappear as the next text Operations Managers appears.
- [2 points] The green arrow pointing to Operations Managers should appear with the text Operations Managers.
- This should all be accomplished in a single slide.
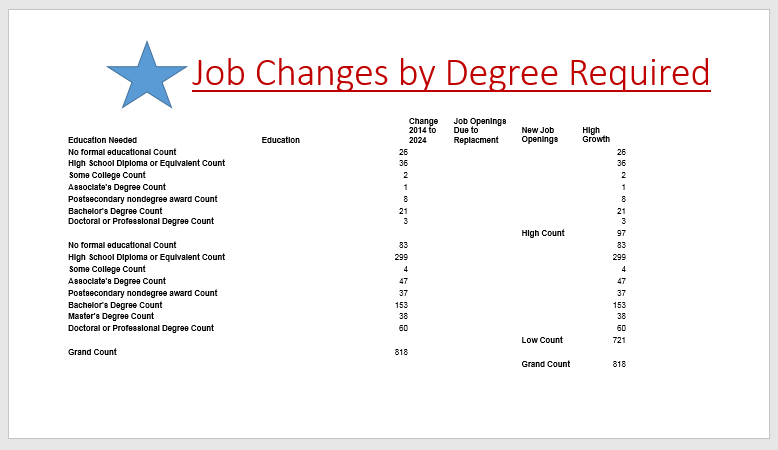
- Add a regular slide.
- Match the image below.
- Include a screen shot from the Subtotal Table in Excel.
-
- Add a conclusion slide
- Match the image below.
-

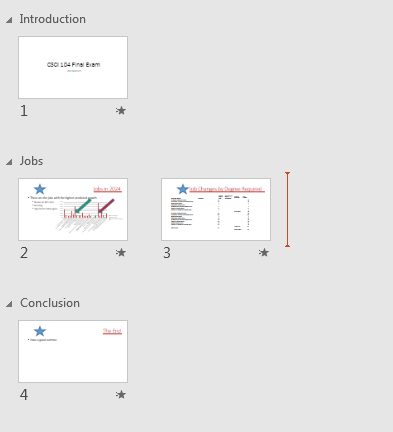
- [3 points] Divide your slide show into three sections.
- The first section, labeled Introduction contains the first slide.
- The second section, labeled Jobs contains the next two slides.
- The third section, labeled Conclusion contains the last slide.
- [2 points] Make the transition between all slides be a Fade.
- A screen shot of the final PowerPoint portion
- Upload all documents to the appropriate drop box folder
- There should be three documents:
- An Excel workbook.
- A Word document.
- A PowerPoint document.
Make sure that you have uploaded the proper version of each.
- Student taking the test in the classroom please upload test to the Final Exam folder.
- Students taking the test at OSD please upload the test to the OSD Final Exam folder.
- Anyone not taking the test at OSD who places a test in this folder will suffer a 10% penalty for using the wrong folder.
- in addition a 10% penalty for each ten minute period the test is submitted after the folder for their class closes will be applied.
- If for some reason you are not taking the test with your class, email all portions of the test as attachments to your instructor (dbennett@edinboro.edu).
- If you miss the folder close time:
- you may email the test to dbennett@edinboro.edu.
- There is a 10% per ten minute period penalty for late submissions based on the time stamp on the email.