The Normal Distribution
- Mathematicians have noticed that some histograms represent basic ways nature behaves.
- There are some general classes
- The uniform or rectangular distribution will be generated by rolling a die a bunch of times.
- Each outcome is equally likely.
- So a histogram of of the results should be uniformly distributed.
- But if we changed the experiment to roll three dice and find the sum
- We could create the normal distribution.
- Or four dice find the sum of the three highest
- We would get a distribution skewed to the left.
- Summing the three lowest would lead to a distribution skewed to the right
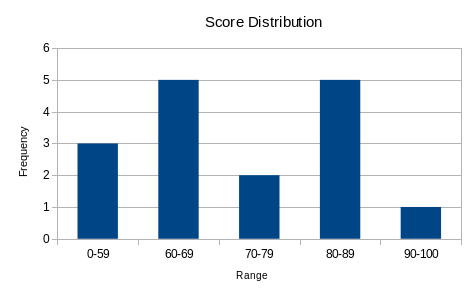
- Tests frequently produce a bimodal distribution.
- Test1 for this class :
- The normal or Gaussian distribution is important because many datasets follow this distribution.
- This is named after Carl Fredrich Gauss, one of my academic ancestors and sometimes called the "Greatest mathematician since antiquity".
- In the normal curve, the mean, median and mode are all the same.
- The curve is known as the "bell shaped curve" is symmetric about the mean.
- 50% of the data is below the mean and 50% of the data is above the mean.
- The empirical rule states
- 68% of the data is within 1 standard deviation of the mean.
- 95% of the data is within 2 standard deviations of the mean.
- 99.7% of the data is within 3 standard deviations of the main.
- If SAT scores are normally distributed with a mean of 500 and a standard distribution of 100
- What percentage of the scores are greater than 500?
- What percentage of the scores are between 400 and 600
- What percentage of the scores are less than 400 or greater than 600?
- What percentage of the scores are between 500 and 600
- What percentage of the scores are greater than 600?
- What range contains 95% of the scores?
- What can you say about 99.7% of the data?
- The empirical rule is nice, but we need more precision.
- There is a table that tells us how a normal distribution with a mean of 0 and a standard deviation of 1 behaves.
- This is on page 822-823
- And will be available to you on the test.
- Be aware that different books present this table in different forms.
- This is called the standard normal distribution
- A study of a weight loss pill includes a control group that has taken a placebo. It is expected that the weight change results for this group will be normal distributed with a mean of 0 and a standard deviation of one pound.
- What percent of the group do you expect to gain weight?
- What percent of the group do you expect to lose weight?
- What percent will lose 1 or more pounds?
- What percent will gain .5 pounds or more?
- What percent will have a weight change between -.3 and .3 pounds?
- What percent will have a weight change greater than 1.7 pounds?
- Since we don't want to generate a new table for every distribution we can reduce other distributions to the standard normal distribution
- To do this, we compute the z-score or standard score
- zx = (x-μ)/σ
- If the z score is
- Negative, the result is below the mean
- Positive, the result is above the mean
- Do some problems page 829