- Estimation is the process of arriving at an approximate answer to a question.
- This is the famous back of the envelope computation
- You can estimate your annual salary for a full time job by taking an hourly wage, doubling it, and multiplying by $1000.
Assume someone makes $8/hour.  The method tells us they would make $16,000

$8     40 hour   52 weeks
---- x ------- x --------  = $8*40*52/year = $16,640/year
hour   1 week    1 year
- Often, we somehow simplify the numbers involved in the computation.
- This includes rounding to an easier value.
- To round a number
- Look at the digit to the right of where the rounding will occur
- If it is 5 or more, add one to the digit to be rounded.
- Replace all digits to the right of the digit to be rounded with 0.
- Examples:
Round the following to the nearest whole number
      2.45     - look at 4, it is less than 5, so the number becomes 2
      2.499999 - same as above 2
      2.5      - 5 is 5 or more so the number becomes 3
      2.87     - same as above
     19.60     - 6 is 5 or more so add 1 to 19 and it becomes 20
- One way to estimate is to round number to make them easier to operate on.
- Example:
I purchase the following items:
   CD     14.73  -> 15.00
   Game    9.99  -> 10.00
   Paper  12.34  -> 12.00
   ----------------------
          37.06  -> 37.00
- There are times when it is beneficial to overestimate
- Like when my kids are going to purchase something, estimating tax is always a problem.
Estimation with Graphs
- Pie charts
- Also called circle graphs.
- Show the percentage of a population that falls into various classes.
- Each class is represented by a sector
- Using this pie chart from Call It Quits.com estimate the number of cases of Lung Cancer represented.
 We see that Lung Cancer represents 78% of the cases, this can be rounded to 80%.
Remember a percentage is converted to a decimal by dividing by 100
80% = .8
There are a total of 159,600 persons represented in this chart so
we can round this to 160,000
We can then estimate that .8x160,000 or 128,000 persons had Lung Cancer
The actual answer is 124,488
We see that Lung Cancer represents 78% of the cases, this can be rounded to 80%.
Remember a percentage is converted to a decimal by dividing by 100

   80% = .8

There are a total of 159,600 persons represented in this chart so
we can round this to 160,000

We can then estimate that .8x160,000 or   128,000 persons had Lung Cancer

The actual answer is 124,488
- Note, in the previous computation, we knew our estimate was high because we rounded up in both cases.
- Bar charts
- A bar chart allows us to view one or more series of data.
- We often have to estimate values.
- Example: The following bar chart is from US DOT
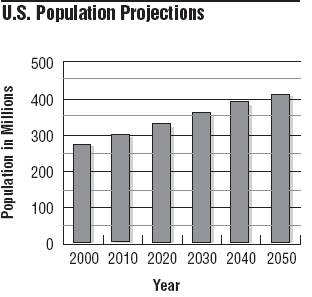 A. What was the population in 2000?
B. What is the estimated population in 2050?
C. What is the change in population between 2000 and 2050
D. What is the estimated annual increase?
A. 275 Million
B. 410 Million
C. 410 Million - 275 Million = 35 Million
D. 35 Million/(2050-2000) = 35(million)/50years = .7Million/year
or 700,000 a year.
A. What was the population in 2000?
B. What is the estimated population in 2050?
C. What is the change in population between 2000 and 2050
D. What is the estimated annual increase?
A. 275 Million
B. 410 Million
C. 410 Million - 275 Million = 35 Million
D. 35 Million/(2050-2000) = 35(million)/50years = .7Million/year
or 700,000 a year.
Mathematical Models
- Can we build a model (or equation) to predict the population of the US?
P = 275 + t*.7
    The results are in millions
    t is the number of years after 2000
- This method only really works for linear models.
- It looks to me like problem 52 will work, but not well with this method.
Estimate the yearly change in tuition
   Change in tuition : 5,200 - 3,100 = 2,100
   Change in years:  2005-1998 = 7

   Annual change:  $2,100/7years  = $157/year  (or 300)

Write a mathematical model
   C = 3,100 + 300x,   where x is the number of years since 1998

Use your model to predict cost in 2010
   x = 12
   C = 3,100 + 300*12
     = 3,100 + 3600
     = 6,700