Computer Literacy at Edinboro
- Today we will look at some advanced counting functions.
- Please download this workbook.
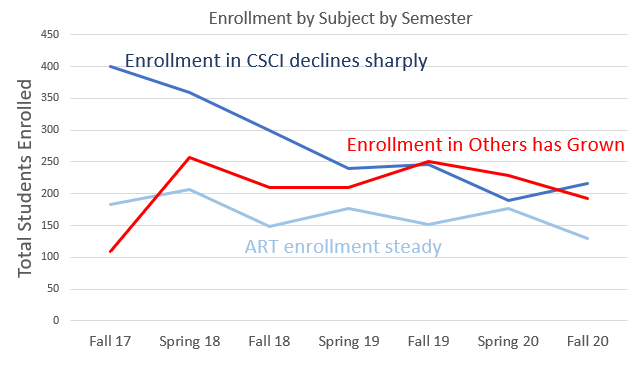
- It represents the enrollment in computer skills classes since Fall 17
- Can we spot any trends in this data?
- How many sections of each class should we schedule for next Fall?
- We are going to look at four or five functions today.
- We can do all of these with pivot tables easily.
- But sometimes you want more flexibility, or more permanence.
- So we will look at these functions.
- Let's start by doing something we know.
- Add a new worksheet.
- Extract the unique values for Subj
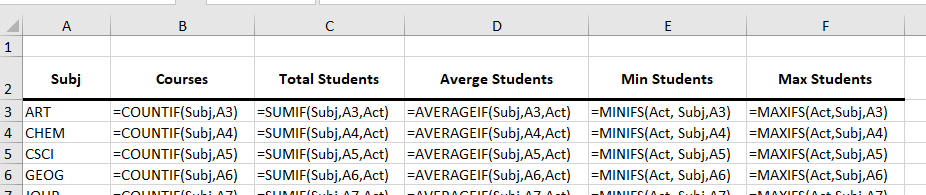
- Count the number of courses offered for each subject.
- There is a sumif as well
- This takes three arguments
- The range to do an if on, just like countif.
- The condition, just like countif
- The range to sum
- =sumif(Subj, A3, Act)
- There is an averageif as well
- minifs, maxifs (more s functions later)
- These go the other way.
- First list the range you want to find the max/min of
- Then the criteria range
- Then the criteria.
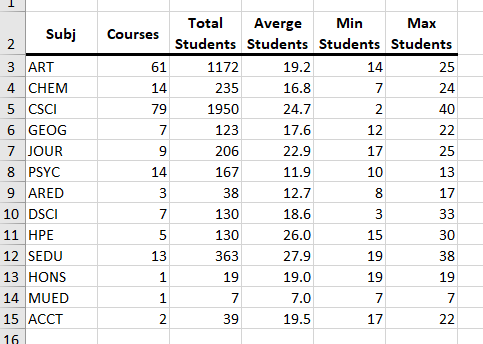
- We should have the following table
-
-
- Let's do the same thing for instructors.
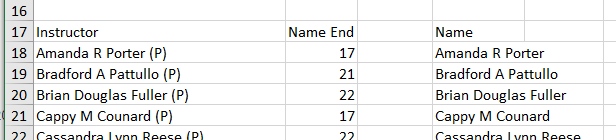
- Get the unique list of instructors.
- Darn, there are some problems.
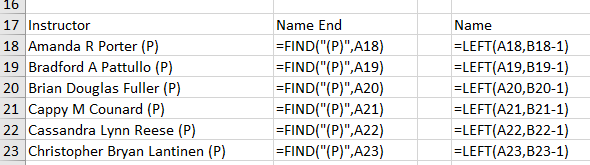
- Let's clean up the name using a few text functions.
- =find("(P)", A18) will find the location of the (
- =left(a18, b18-1) will return the left part of the string.
-
-
- We will need to copy the data and paste as values.
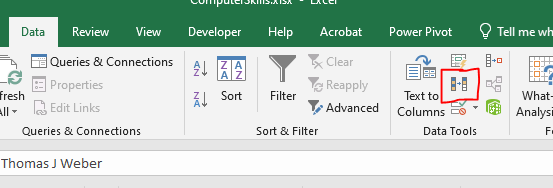
- Then use Data Data Tools Remove Duplicates To remove the duplicate names.
-
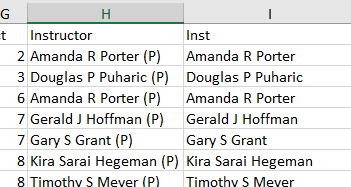
- We will need to apply the same cleanup to the data in the Cleaned Data table.
- Insert a new column between H and J.
- This is more complex but insert the formula
- = left(H2, find("(",h2)-1)
-
-
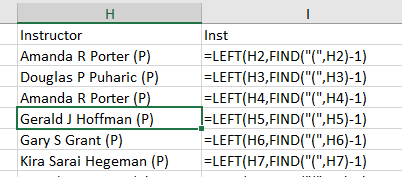
- I called this inst
- The rest of this exercise should be fairly straight forward.
The *s functions allow us to use multiple criteria.
- They generally take
- Something to count, sum, average, ...
- A range
- A criteria for that range.
- ...
- Countifs is the exception to this.
- let's build a table of enrollment by Subject by Semester.
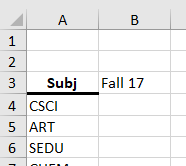
- Create a new worksheet
- Copy the subjects from the previous sheet.
- Next to Subj, put Fall17, the first semester.
-
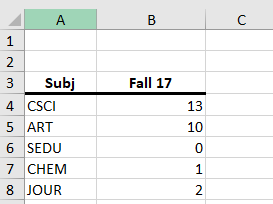
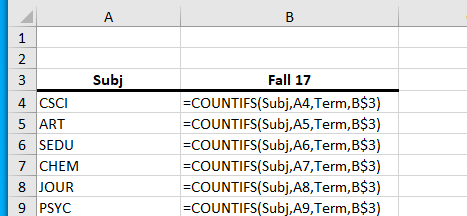
- Count the classes with Subject CSCI and Semester Fall 17
- Don't forget the $ to copy it down.
- Might as well put in a $ so we can copy it across.
-
-
- Finish this table.
-
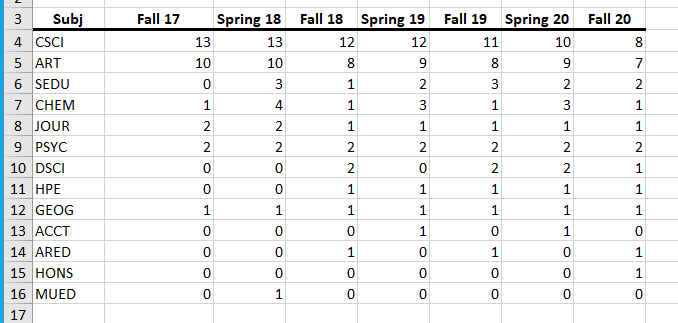
- Add a total line for each semester.
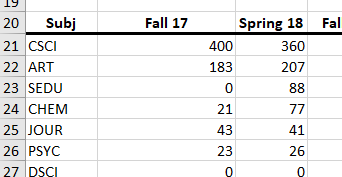
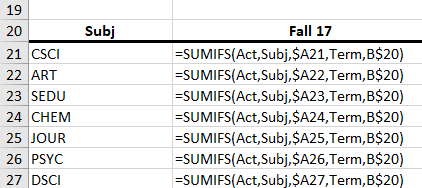
- Let's build the same table, but this time, lets sum up the students.
- Copy the subjects and the months to a new location.
- sumifs follows the pattern above.
-
-
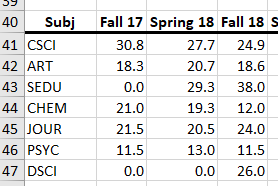
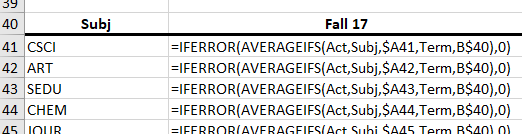
- Build a table using averageifs to compute the average per semester per subject.
- Darn, a bunch of division by 0 errors.
-
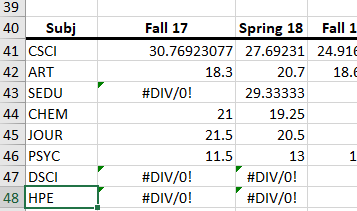
- =iferror(function, alternative)
-
-
- Let's build a few charts demonstrating how enrollment has changed.
-