- Data Science/Analytics generally cosists of the following steps
- You have a question that needs answered, but the answer should be based on data.
- You collect data that could contain the answer to your question.
- You clean the data and format it so that it can be analized.
- You perform basic data exploration to understand the data.
- You look for relationships among the data that can be used to predict the answer to your question.
- You build a mathematical model, based on the data, to answer your question.
- You test and use your model.
- I wanted to understand who was in this class.
- Questions: Is there anything special I should be doing for this class?
- Step 1, Find some data:
- My only real data was from SCOTS.
- We have access to a detailed class list.
-
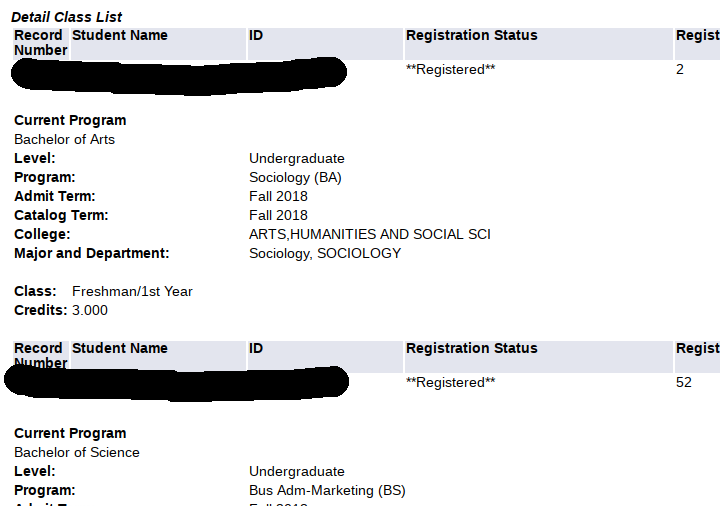
- Unfortunately this is
- A web page, (in html)
- And not directly accessible (you will see why this is important later).
- Step 2: Acquire and transform the data.
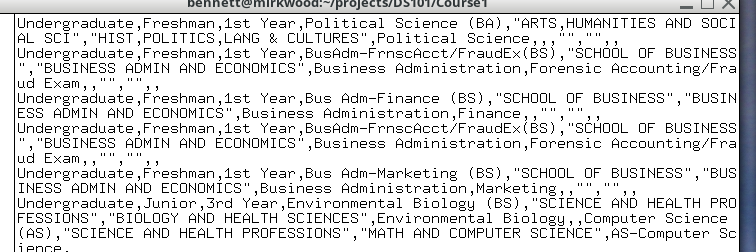
- I did a copy and paste from the web page into a text file.
-
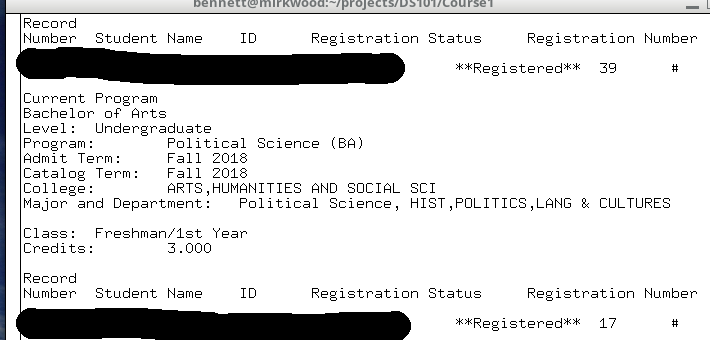
- This is not terribly useful, so I wrote a python script to convert this to a Comma Separated Value or (CSV) file.
-
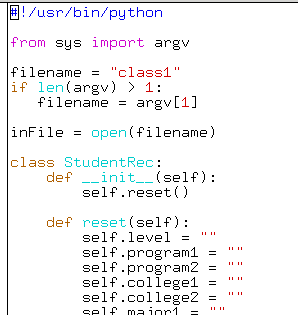
- reader.py
- This produced
-
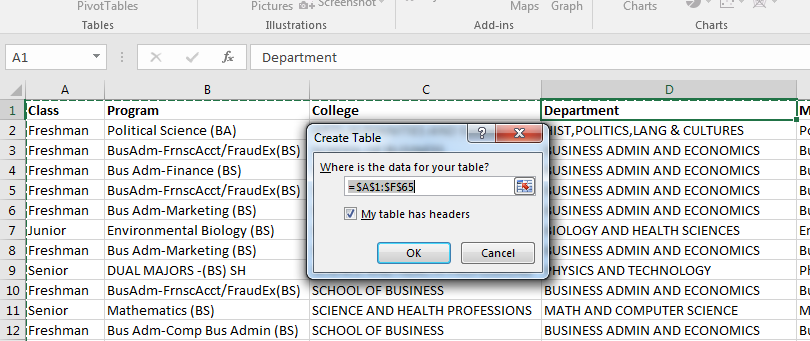
- Step 3: Import and clean the data.
- Just clicking on a CSV file will start Excel.
-
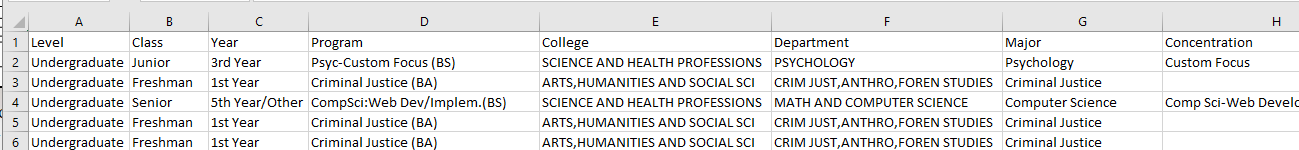
- The data consists of
- Level (undergraduate/graduate)
- Class (Freshman, Sophomore, Junior, Senior)
- Year
- Program
- College
- Department
- Major
- Concentration
- These are not labeled, so I labeled them
-
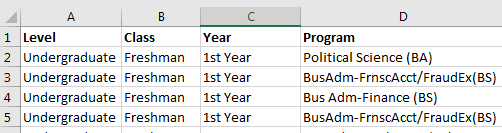
- I really don't care about the Level, Year, and any secondary degree information.
- So I removed these fields.
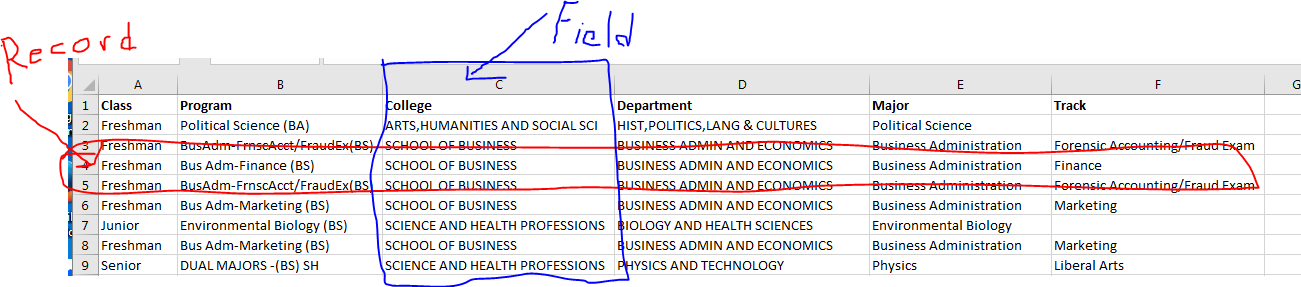
- By the way, two definitions
- A record is a collection of information about an individual element of the population.
- In this case the data on each of you constitutes a record.
- In some cases, it might be an individual measurement.
- But it is all the data associated with the individual/measurement, ...
- A field is a piece of data in a record.
- In this case the Class, Program, College, Department, Major and Track are fields.
- Records are composed of fields.
-
- Hopefully datasets are composed of records and fields.
- At this point we should note
- For multiple degree students, we would have the first degree listed, not all degrees.
- Not all students have tracks.
- Step 4 basic data exploration
- Easy data exploration is to turn the worksheet into a table.
-
- This allows you to filter the data
-
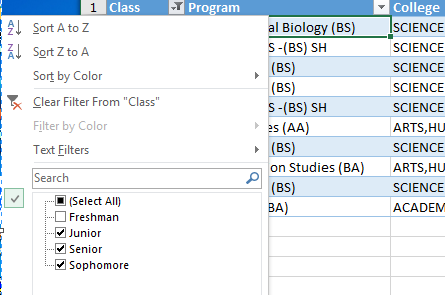
- And see that we have about 20 upperclassmen.
-
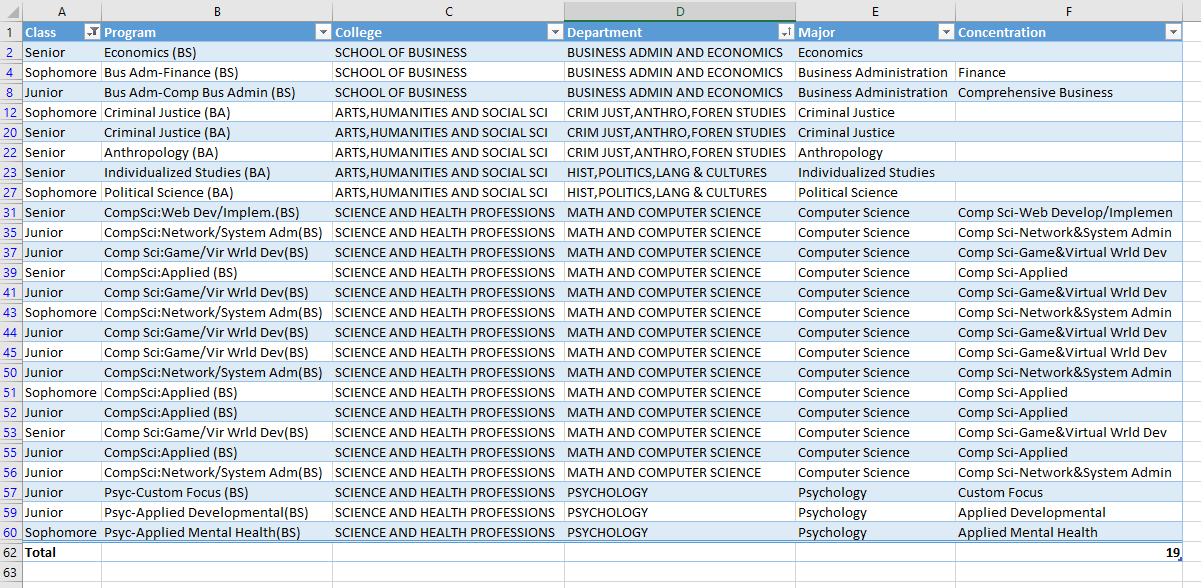
- This is interesting to me.
- Last year nearly everyone was a freshman.
- The only upperclassmen were Math/CS Majors
- And those were Seniors.
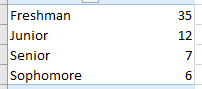
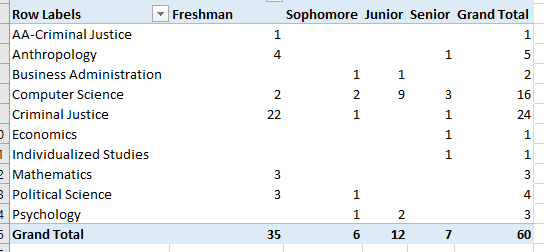
- Building a pivot table allows additional exploration
- We can easily calculate the distribution of students by class
-
- Or we can even explore Major by Level
-
-
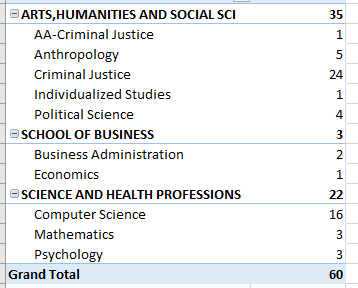
- We can even produce a view of the counts by college/Program
-
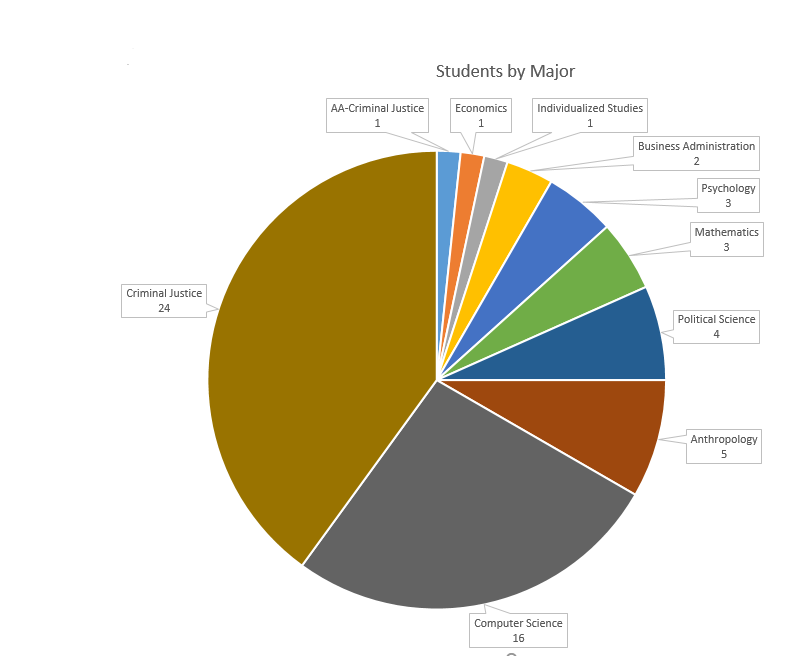
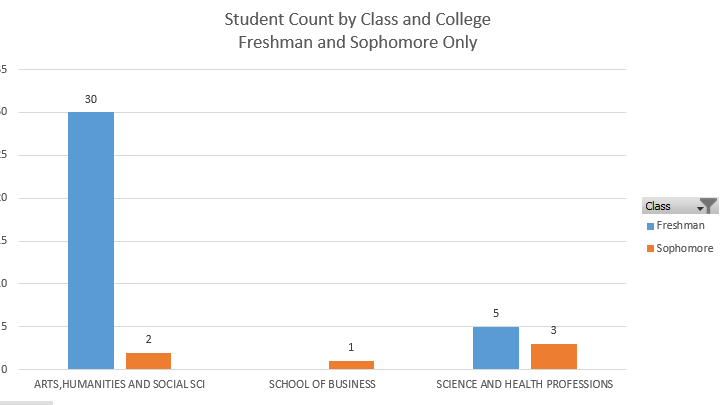
- One more chart
- Step 5: Interpretations/Recommendations
The majority of the students in this class are freshmen.
- Pay attention to freshman type issues.
- The majority of students are from CJ, Anth, Poly Sci.
- Make sure to point the class to appropriate data sources for the project.
- There is a large group of upperclass CS majors.
- Is this due to the overlap in classes -> easy minor?
- Discuss alternative possibilities.
- These conclusions might seem obvious,
- But the class is surprisingly different from last year!
- This is data driven decision making.
- A next step
- The next step in the data science process would be to make predictions
- This doesn't have an impact on you for two reasons
- We will not go that far this semester
- Any predictions that I can think of would be for the next offerings of this class.
- How many sections/seats of DSCI 101 should we offer?
-
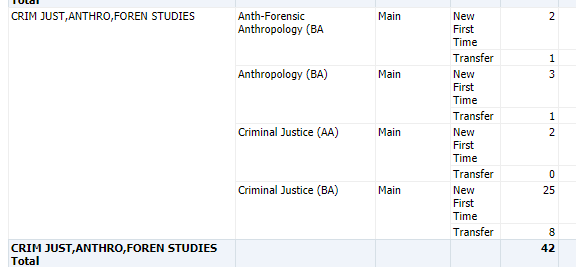
- 5 new Anth/Forensic Anth students registered, 4 Anth Freshmen in the class.
- 27 new CJ students registered, 22 CJ Freshmen in the class.
- 3 new Math majors, 3 registered for the class.
- It looks like these majors are being assigned to this class.
- Seats in the class should be take this into account.
- The data files