Finishing the Basic Numeric Field Analysis
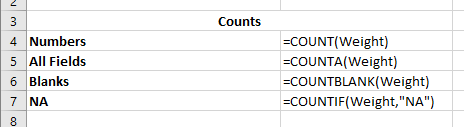
- Sometimes we wish to count the occurrence of a specific value
- The countif function is useful for this.
- It is powerful, but a little more difficult to use.
- For today, we will just learn the basics.
- =countif(range, criteria)
- the range is easy, we will use weight.
- The criteria comes in many forms.
- Since we are looking for a specific value, we can just use that
- =countif(Weight, "NA")
- Note we need to put NA inside of quotes.
-
- Some additional statistical functions
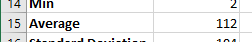
- The average is the normal measure of central tendency.
- Sum all of the values and divide by the number of values.
- =average(range)
- Like most functions, this will ignore blanks and text.
-

-
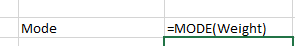
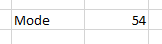
- Another measure of central tendency is mode.
- The mode is the most frequently occurring number
- =mode is deprecated
- =mode.sngl(range) will find the first of the modes if there are multiple modes
- =mode.mult(range) will find all of the most frequently occurring numbers.
- This is more tricky to use because it is an Array function
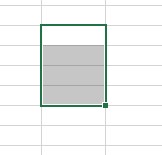
- Highlight a number of cells you want the answer to be placed in
-
- enter the formula
-
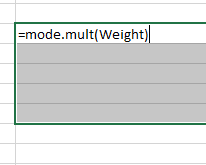
- press ctrl-shift-enter, not just enter.
-

- You can not edit individual cells in an array.
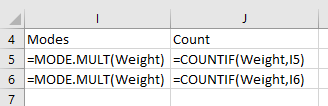
- Redo this to contain just two cells.
- Let's count the number of cells in the weight column that are 55 and 79
-
-
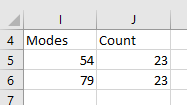
- Notice I can use a cell reference in a countif.
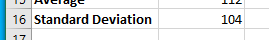
- Standard Deviation
- The standard deviation is a measure of how spread out the data is.
- It is normal to include this value.
- Three functions
- stdev is deprecated and should not be used.
- stdev.P is the standard deviation of a population
- This assumes you have all of the data for every possible item.
- You probably don't want to use this.
- stdev.S is the standard deviation for a sample.
-

-
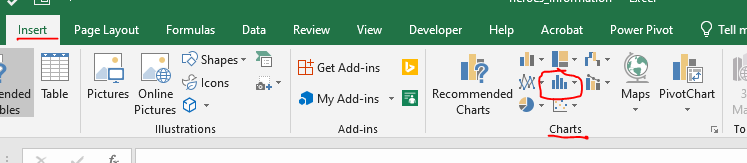
- There are two charts that are useful with numeric fields.
- A histogram
- When there are many different values, a histogram summarizes the data nicely.
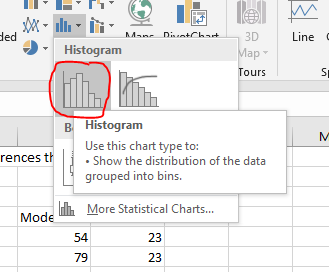
- Insert tab, Charts command group and the Insert Statistic Chart dropdown.
-
- Select Histogram
-
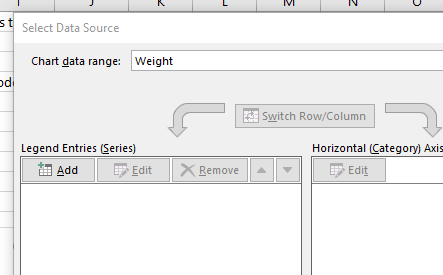
- In the Chart Tools: Design special tab, choose Select Data in the data command group.
-
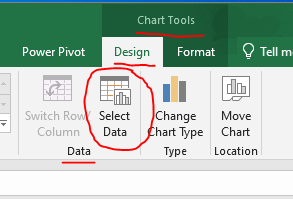
- Enter Weight in the Chart data range box.
-
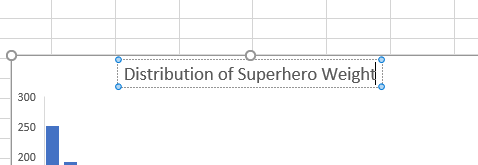
- Double click and change the Chart Title to be Distribution of Superhero Weights.
-
- Click on the chart, then the + sign to the right and turn on axis titles
-
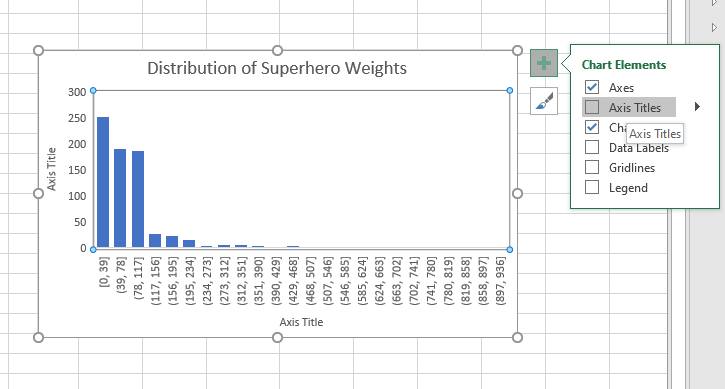
- Add an appropriate axis titles.
-
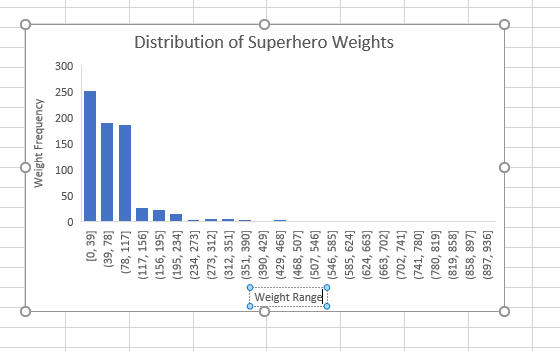
- I like to show data labels as well.
- A Box and Whisker plot