Getting Started on the Project
- I'd like to do a "mini" project to show what I expect.
- To make it fit into class, so the scope is limited.
- We will do some things in word and excel that you might not know
- We will revisit these later.
- This is outside my normal operating procedures, but I am going to try a show then go into details later.
- IE don't worry if you don't know all of the Office parts right now, we will be back.
- I have cheated and have done some of the work ahead of time.
- Let's start by reviewing the data on the project assignment page
- Selecting the dataset is a huge problem, we will probably put that off.
- But you should starting thinking about it right now.
- What are you interested in that might have data
- Start looking for that data.
- Make sure you read the requirements
- For this project, I have selected the Super Heroes Dataset.
- This is available on Kaggle.com.
- A local copy of this dataset is here.
- I am making this available for educational purposes for the DSCI 101 class. If you are not in this class, please join kaggle and get your own copy.
- Members of the class, Kaggle is an outstanding source for datasets. You need to sign up to gain access.
- Before we start, note the information available on the page.
- We want to record the source of the data.
- We want to record the original source of the data too.
- Start word.
- Let's start working on the proposal document
- Look at the categories under "Your proposal should document this dataset including"
- Place a line in your document for each.
-
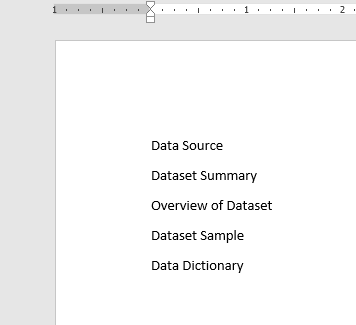
- Mark these as headers.
- Select the first heading.
- On the Home tab, in the
Styles workgroup select Heading 1
-
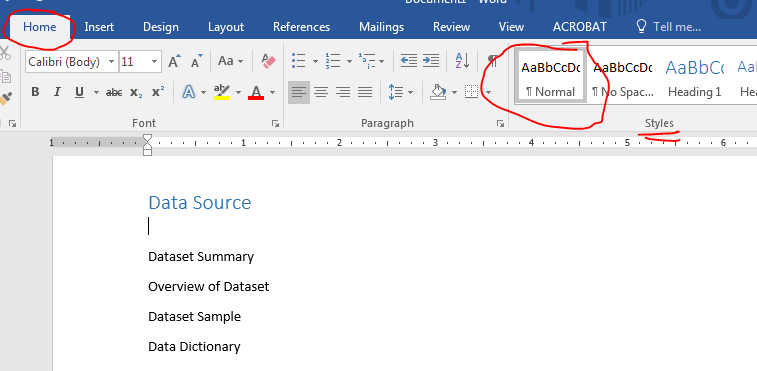
- Now select the format painter on the Home tab in the Clipboard workgroup.
-
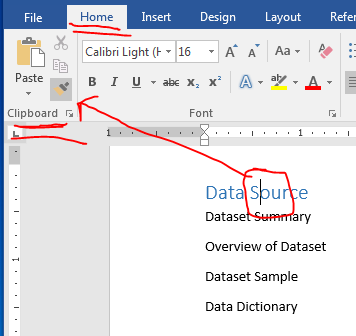
- I double clicked because I want to paint several items.
- A single click will allow you to paint a single item.
- Highlight the text you wish format with the copied format.
- If you single clicked on the paintbrush you will need to repeat the process of selecting the paint brush.
- If you double clicked, you need to click on the paint brush again when you are finished.
- insert a reference to the kaggle page and the original source.
- Go to the References, in the Citations & Bibliography workgroup.
- Select the proper bibliography Style using the Style menu.
-
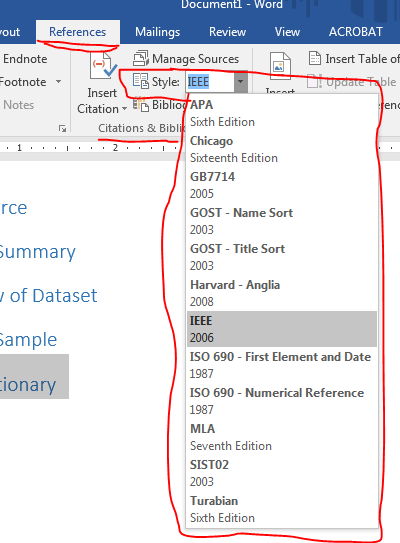
- In my discipline, I use IEEE.
- You should use the appropriate style for your discipline.
- Or use MLA or APA.
- Later we will discuss how you could build your own style.
- Select Manage Sources in the same workgroup.
- If there are any existing sources in your Master List, transfer over any that are valid.
- Insert a new source by selecting New
-
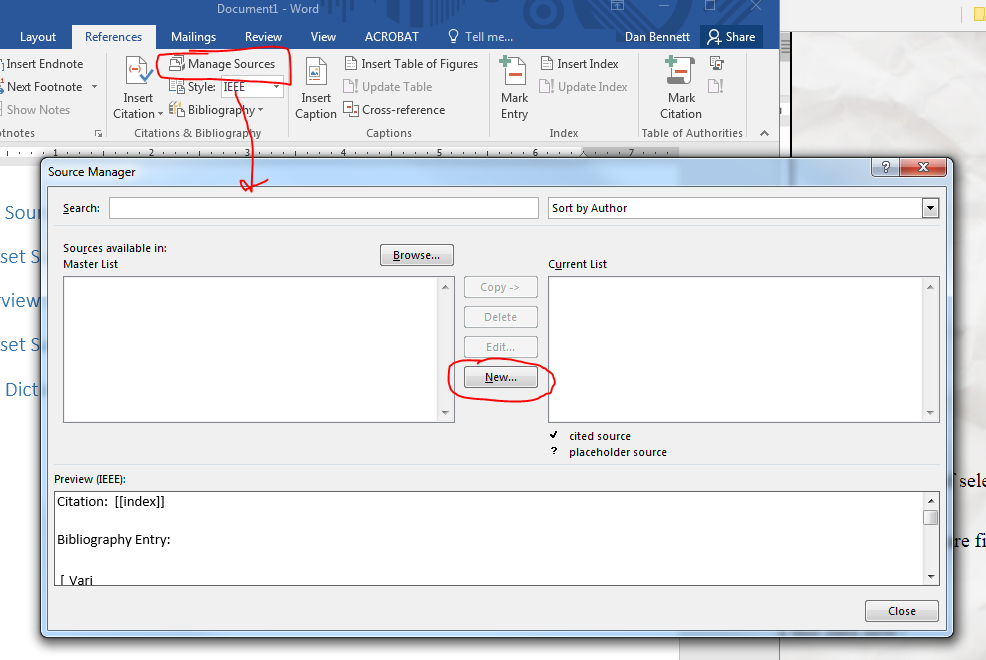
- This will bring up the Create Source dialog box.
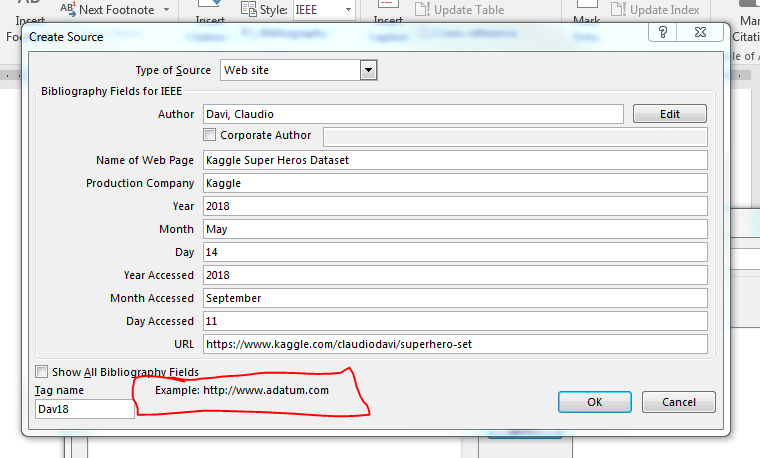
- Make sure you select the proper type, Web site in this case.
- Fill in all the fields you can
- Accuracy is the problem here.
- An example is given in the lower right hand corner, follow it.
-
- Cite the source
- Put some text, later this will be where you wish to cite the source.
- Put the cursor where you wish to cite the source.
- Click on Insert Citation in the same workgroup.
- Select the proper citation.
-

- This will insert the citation
-
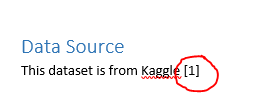
- Note, in IEEE the citation is [1], this is not how it is done in other standards.
- While we are at it, let's build a bib.
- Go to the end of the document.
- On the Layout tab, Page Setup workgroup select the Breaks dropdown.
- select Next Page Break
-
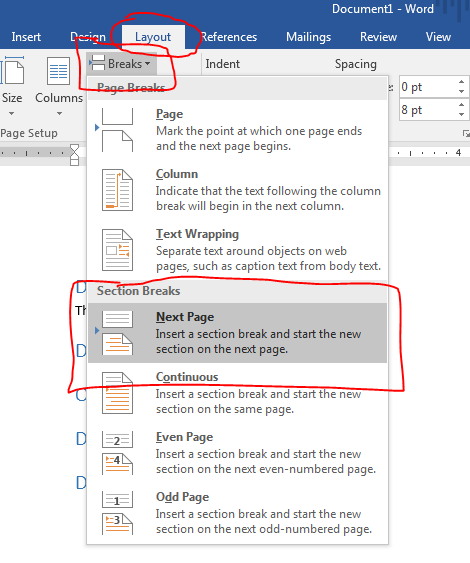
- This will move us to a new page.
- It will also move us to a new section, but more on that later.
- Go to the References, in the Citations & Bibliography workgroup.
- Select the Bibliography menu and select the appropriate table.
-
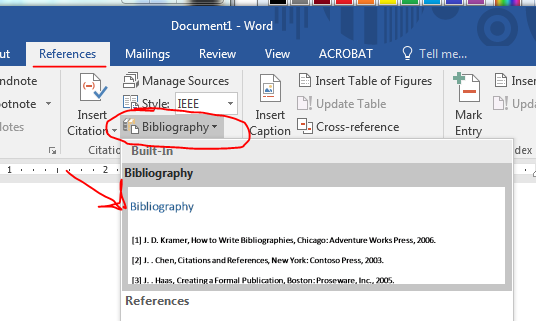
- This will produce a bib.
-

- Make some notes.
- Look at the requirements for the various documents, can we collect any of this data now?
- If so, either do it
- or make some notes so that you know what to do in the future
- It is easier to do this now than hunt the source down again in the future
- At least insert a citation to the pages.
Download the file
- Download the file, right click, file save as,
- Save it somewhere you can find it.
- You could use the OneDrive
- Or you could use a USB drive.
- This is important, don't lose your work.
- I would probably make a project folder.
- Log into one drive.
- Make a new folder.
- Drag stuff to the folder from the desktop.
- Both the word document and the dataset.
- Make sure that you label everything appropriately
- File names are a good start.
- Make a README file in the directory in word or notepad to keep notes.
- Update the project documents whenever possible.
- You will be happy you did this in the end.
- Windows has become very good at opening files of different types.
Let's kick the tires on the dataset
- Double click on the downloaded file, it is probably in Downloads.

- You may want to adjust the file display so you can see details.
-
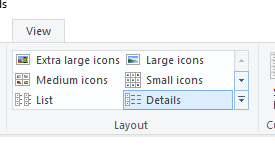
- This will show that there are two CSV files in the zip file holding everything.

- We will discuss file formats later.
- But a zip file is a way to package multiple files into one.
- It also allows you to compress the data so it takes less space.
- We probably want to archive this, so make a copy of the original CSV file.
- So copy it to your new folder.
- For today we will just work with the heros_information.csv file.
- Later you might want to work with the super_hero_powers.csv file as well.
- Oh, this is probably the time go back into the proposal document and note
- The original was a zip file containing these two csv files.
- The size of the csv files.
- You can get this from file browser.
- You probably want to save the file you just opened.
- This will give you the opportunity to convert it to an excel workbook, not a csv file.
- File save as, select excel not CSV.
What do we have?
- Do we have records?
- Do we have structured data?
-

- Put this into the data description document.
- I want to keep the headers on top at all times
- Select the View tab.
- In the Window workgroup select the Freeze Panes menu
- Select "Freeze the Top Row"
-

- This will let us scroll down through the data keeping the column headings visible.
- I'll probably make the headers bold, fix the case and that sort of thing because it bothers me.
- Do you see anything strange in the data?
- There are -99 in the Weight and Height columns
- There is a - in other columns.
- Can we assume this means the data is missing?
- What should we do about this?
- Make a note in the documentation
- We will discuss cleaning data later
- What is in column A?
A quick look at alignment.
- We should do this on another worksheet
- But for now, let's just stick with the main sheet.
- I would like to explore Alignment, what are the values?
- Scrolling down through it looks like good and bad
- There is a - for "Anti-Venom"
- It is ok to scan by hand, but we should probably do better than this
- Working by hand tends to
- Take more time.
- Is error prone.
- Is not reproducible.
- So let's make a list of the values in column j.
- Select column J by clicking on it.
- Go to the Data tab
- In the Sort & Filter workgroup
-

- Select Advanced
- Select Copy to another location as the action
- I did a copy to M2
- Select Unique records only.
-
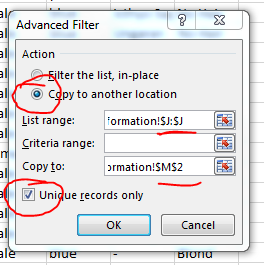
- This made a list of all of the different alignments.
-
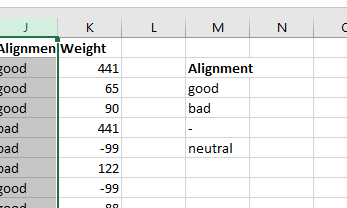
- Note that there is good, bad, neutral and -
- Let's do a quick count of how many there are of each
- In cell N3, =countif(j:j,m3)
-
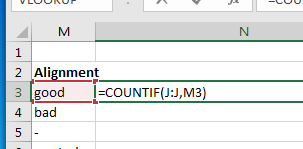
- Copy this down to cells n4:n6
- Add a column heading in N2 (Count)
-
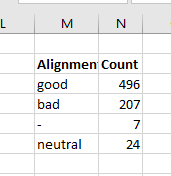
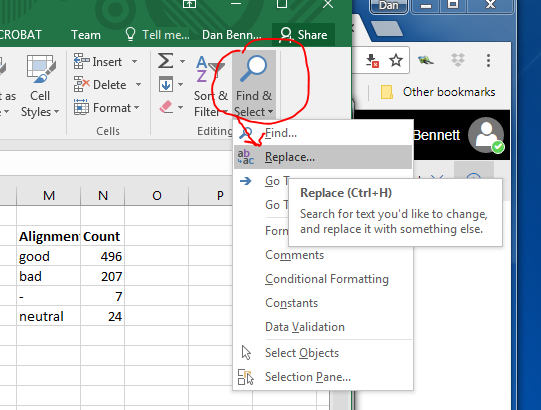
- I think it wold be good to replace the - with Unknown
- Select column j
- Home, Editing, Select & Find
- Replace
-
- - with Unknown.
-
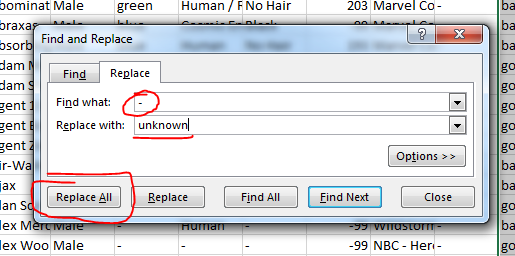
- Replace all
- This should respond with 7 replacements
-
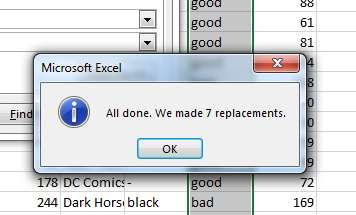
- BUT ALSO
- Document this in your methods document
- Don't have one yet? START ONE
- Describe the problem with a - in alignment.
- Describe why you decided to replace the - with unknown
- Consider adding screen shots describing the action.
- Make sure you change the - in cell M5 to be unknown as well.
- One last thing with alignment
- Let's make a quick circle (or pie) chart.
- Highlight M2:N6
- Select Pie chart on the Charts workgroup of the Insert tab.
-
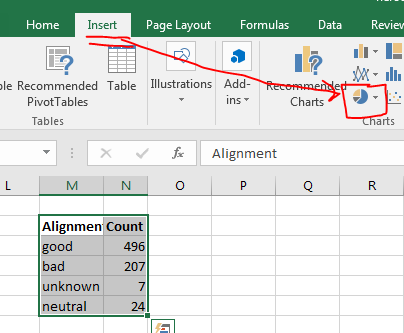
- Mess with various features until you get the chart you feel is informative
- Except don't mess with the data, that would violate professional ethics of a data scientist.
- We will do way more with charts later in the course.
- But the interface is intuitive.
- And the ability to visualize information is really helpful.
-
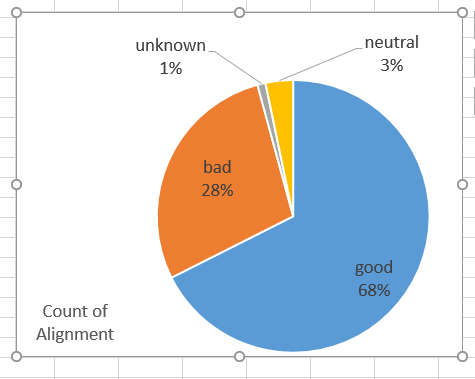
- By the way, this information would be useful in some of the reports as well.
I would like to quickly see how alignment and gender compare
- This is way too early, but I am curious
- Click somewhere inside of the data
- This will work if the data has no "gaps" in it
- Blank rows or columns
- Notice in the picture below that the entire table has been selected.
- On the Insert tab, click in the Tables workgroup, and select the Pivot Table choice
-

- Let the defaults alone and select ok.
- This will bring us to a new worksheet
-

- Drag Name into the Values box
-

- Drag Alignment into the Rows box
-

- Drag Gender into the Columns box.
-

- Looks like we have a gender field to fix (-)
-

- This tool is incredibly useful but that makes it complex.
- We will discuss it in this class.
- We will discuss it further in DSCI 201 if you decide on that option.
- One useful item is to change the way the table displays the data
- Right click in a cell in the table
- This will bring up a menu, select Show Values as
- Select an appropriate display
-

- Here I am showing the values as a percent of the grand total.
-

- Other information can be obtained by other displays. Explore this.
Take Away
- Document your work as you do it.
- Automate as many tasks as possible
- Changing data
- Calculations
- Don't use either excel or word as a typewriter.


