- I wanted to understand who was in this class.
- Questions: Is there anything special I should be doing for this class?
- Step 1, Find some data:
- My only real data was from SCOTS.
- We have access to a detailed class list.
-
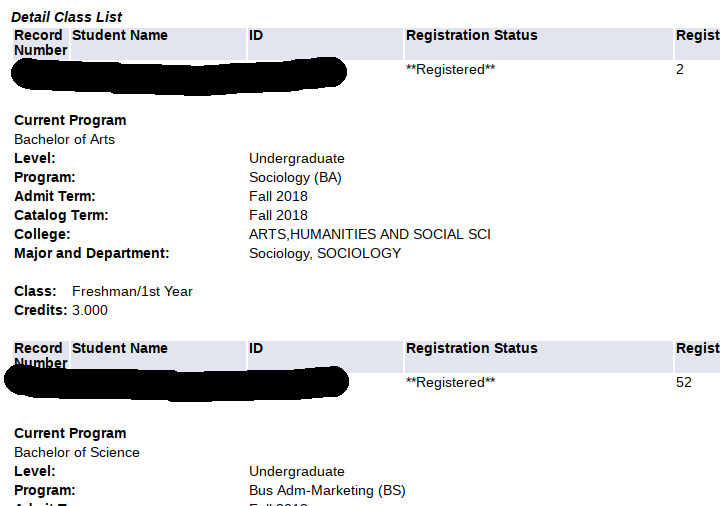
- Unfortunately this is
- A web page, (in html)
- And not directly accessible (you will see why this is important later).
- Step 2: Acquire and transform the data.
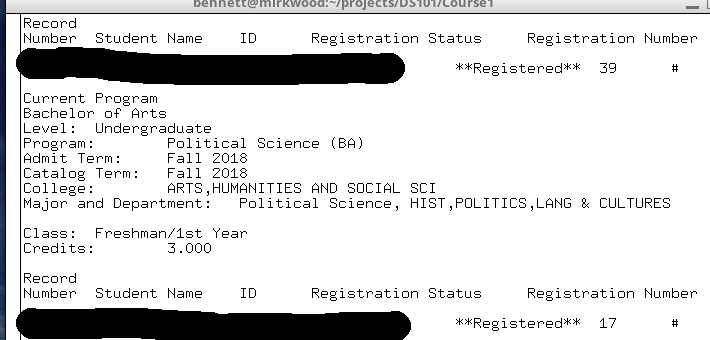
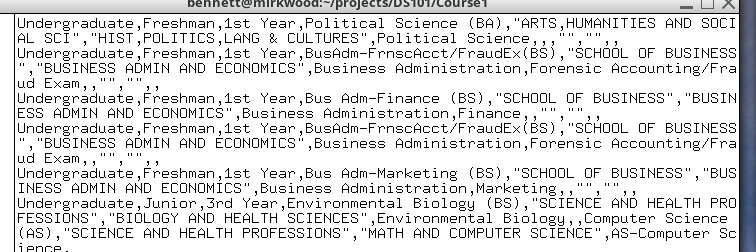
- I did a copy and paste from the web page into a text file.
-
- This is not terribly useful, so I wrote a python script to convert this to a Comma Separated Value or (CSV) file.
-
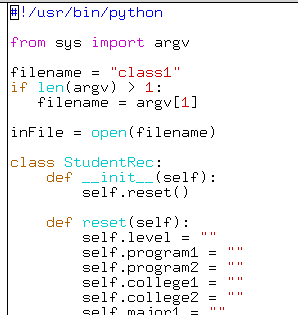
- reader.py
- This produced
-
- Step 3: Import and clean the data.
- Just clicking on a CSV file will start Excel.
-
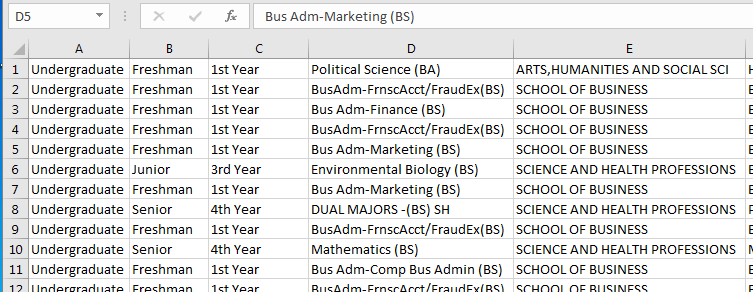
- The data consists of
- Level (undergraduate/graduate)
- Class (Freshman, Sophomore, Junior, Senior)
- Year
- First Program
- First College
- First Department
- First Program
- First Track
- Second Program Information
- Second College
- Second Department
- Second Program
- Second Track
- These are not labeled, so I labeled them
-
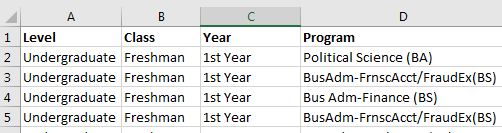
- I really don't care about the Level, Year, and any secondary degree information.
- So I removed these fields.
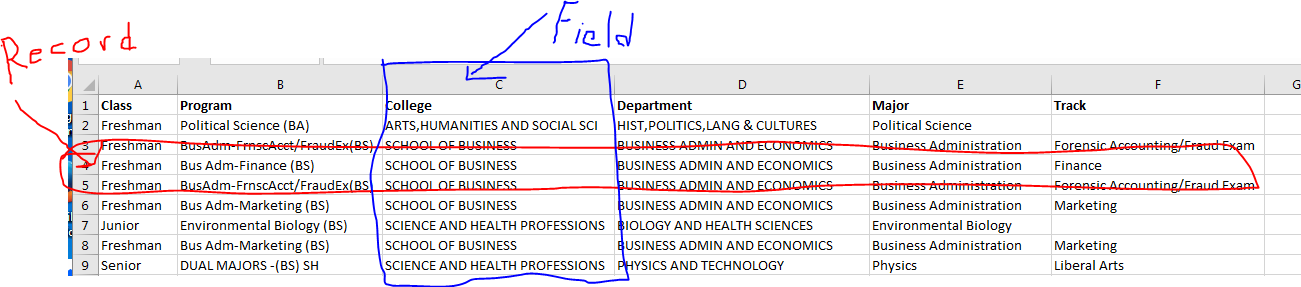
- By the way, two definitions
- A record is a collection of information about an individual element of the population.
- In this case the data on each of you constitutes a record.
- In some cases, it might be an individual measurement.
- But it is all the data associated with the individual/measurement, ...
- A field is a piece of data in a record.
- In this case the Class, Program, College, Department, Major and Track are fields.
- Records are composed of fields.
-
- Hopefully datasets are composed of records.
- At this point we should note
- For multiple degree students, we have the first degree listed, not all degrees.
- Not all students have tracks.
- Step 4 basic data exploration
- Easy data exploration is to turn the worksheet into a table.
-
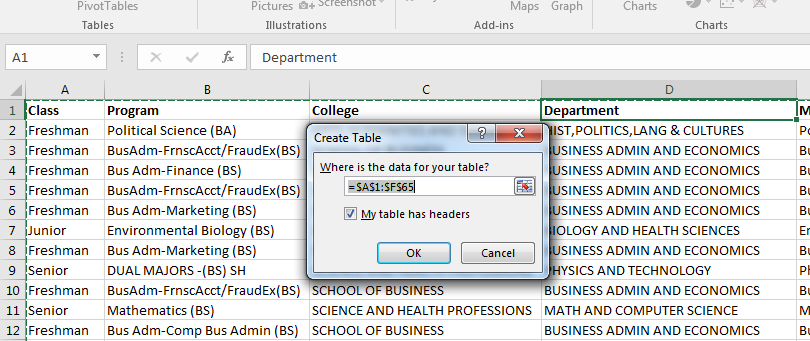
- This allows you to filter the data
-
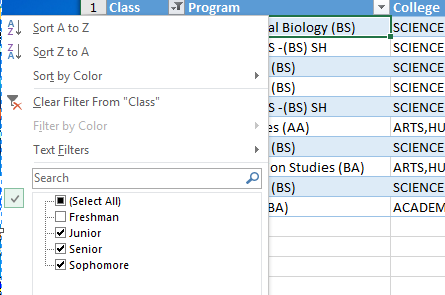
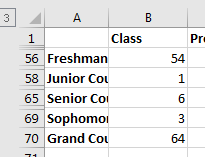
- And see that we mostly have freshmen,
-
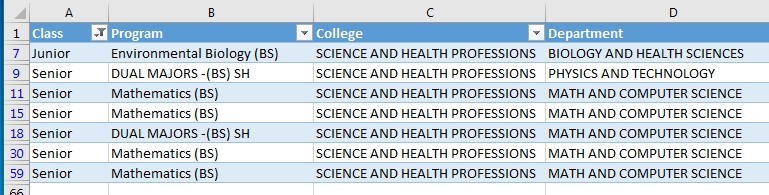
- Note: the upperclassmen are all science majors.
- Removing the table, subtotals provide an easy way to see the class counts
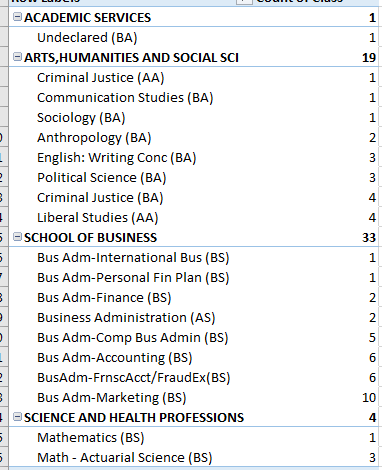
- Building a pivot table allows additional exploration
- What colleges are the Freshmen/Sophomores from?
-
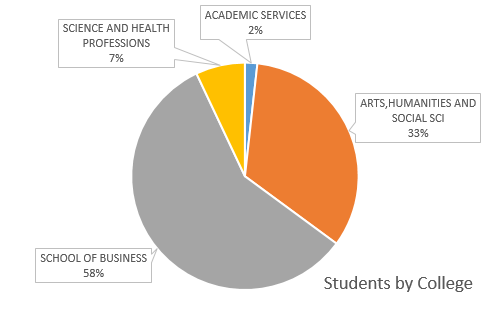
- We can even produce a view of the counts by college/Program
-
- Step 5: Interpretations/Recommendations
- There is a small number of Juniors/Seniors enrolled in this class
- All are science majors.
- Most have credit for computer skills. (Look each one up on SCOTS)
- Recommendation: Have an alternative for these students.
- The majority of the remaining students are first semester freshmen
- Recommendation: Make sure to pay attention to freshman issues.
- The majority of the freshmen are likely to have or need quantitative
- Recommendation: Make sure that basics are covered but some chance for more quantitative analysis.
- Recommendation: Look for more business oriented data sets.
- The data files