This assignment is worth 20 points.
One way to generate an space filling Osgood curve is to start with a list of triangles. These may share edges and vertexes, but should not intersect. Repeat the following
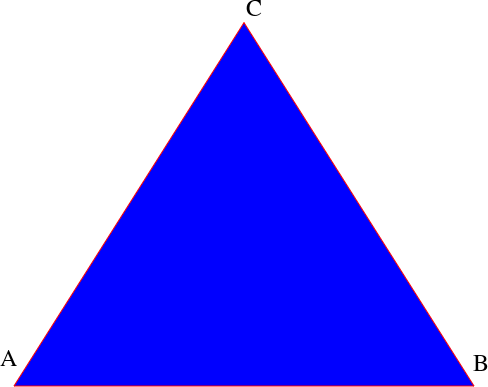
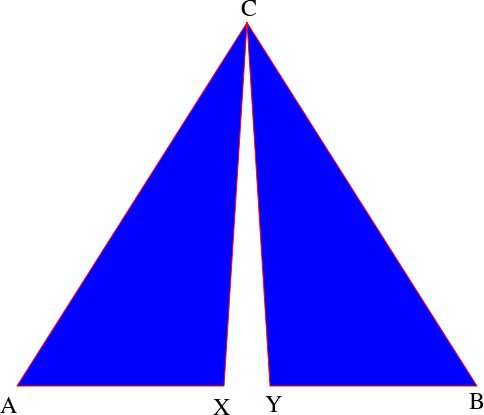
    For each triangle ABC
       Find the longest edge.
       In the case of a "tie" for longest, select the "first" edge.
       // Assume the edge is AB
       Split that edge at points X and Y such that segments  AX and BY are of equal length.
       Replace ABC with AXC and YBC
Repeat this process.


If you were trying to fill space, the process would repeat indefinitely. For graphics, stopping when the new edges have length of 1 or less is sufficient.
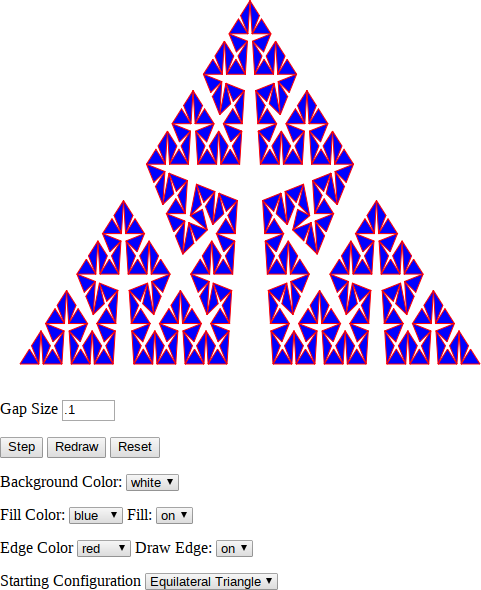
Your assignment is to employ this algorithm to generate, then display each stage of an example of an Osgood curve. This should be done in javascript, displaying on an 2D HTML5 canvas. You should use HTML to implement a user interface.
You should provide an interface which allows control of the following aspects:
Good design practice says that you should provide default values to your interface from the model. This is somewhat difficult so you may hard code your interface to match your default values.
You must provide a number of different starting configurations. This includes an equilateral triangle. The first segment, AB, is as follows.
    A: (20, height-20)
    B: (width-20, height-20)
Please note, this triangle will change with the size of the canvas and should be valid as long as the canvas is wider than 40 pixels of sufficient height.
Please provide at least two additional different starting configurations.
To draw a filled polygon in the HTML5 canvas:
context.beginPath();
context.moveTo(p1.x,p1.y);
context.lineTo(p2.x,p2.y);
...
context.lineTo(pn.x,pn.y);
context.closePath();

// fill the polygon
// only needed if the polygon is filled.
context.fill();
// draw the edge
// only nedged if the edges are to be drawn.
context.stroke();
If you do decide to continue some interesting additions might include
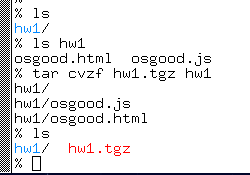
To create a tar file
So for example, if osgood.html and osgood.js are my files for this project and are in a directory called hw1 in the current directory, the following screen shot shows how to create an acceptable tar file:
Submit your tar file as an attachment to a message to danbennett360@gmail.com. Please include your name, and the fact that this is homework 1 in the title of the message.