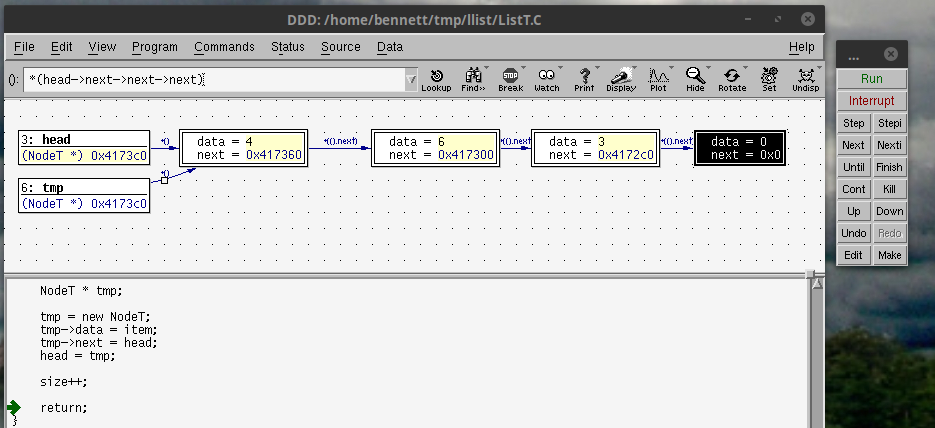
A Quick GDB Tour
- GDB is the Gnu Debugger.
- A debugger allows you to inspect variables while code is executing.
- It is a standard tool.
- To use
- Code must be compiled with a -g flag. (we do)
- run with gdb progname
- several commands
- Break (b) - set a breakpoint
- break line-number
- break file:line-number
- break function
- break file:function
- start - begin executing code
- starti - starts, but breaks at first executable line.
- continue (c) - run until next break point.
- step (s) - execute until next source code line
- next (n) - execute next source code line in this function.
- Printing (p)
- print varname
- print * pointer
- print pointer->field
- list (l) - list code
- list
- list lineno
- list function-name
- quit
- bt - back-trace
- Shows where you are in a function call.
- print pointer->field
- There are multiple GUI interfaces
