Excel Test.
- You may use books and notes for this portion of the test.
- You may print these instructions if you feel that would be helpful.
- Please save your work often, so that you may recover in the case of an error or system crash.
- Please put your name on your worksheet.
- Images of my sheet are for reference, and have colored lines added
- Formatting
- Use a copy of this worksheet. You will probably want to save it then open it in excel, if you just open it in the web browser, you will probably have problems.
- [1 point] Put your name in Cell A1.
- [2 points] For each table, center the table title above the table, merging cells as necessary.
- [2 points] Make the titles bold, 16 point font, with a gray background.
- [2 points] Make the column headings in bold, centered, 11 point font
- [2 points] Place a 2 point border around the data values of the tables.
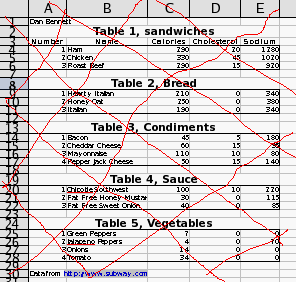
- [1 point] Place Data from the Subway Web page (http://www.subway.com) in cell A 30.
- My sheet looked like this.
-
- General Usage
- [2 pints] Insert a new worksheet named Nutrition. This
should be the second sheet worksheet in your workbook.
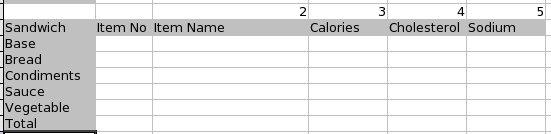
- [2 points] Set up the following table headings in cells A1-F8.
-
- [1 point] In cells B3-B7 place a 1.
- [5 points] In cell C3, develop a formula that will find the name of the sandwich base name.
- This should refer to cell B3 for the item to look up
- Table 1 for the item name
- Cell C1 for the column number to return.
- Make this formula so that you can copy it across columns D, E and F.
- Make this formula so that the entire table can be copied down for a new sandwich later.
- [5 points] Repeat this procedure for rows 4-7, use the correct table.
- [2 points] In Cells D8-F8 total the column above.
- Your table should look something like the picture below.
-
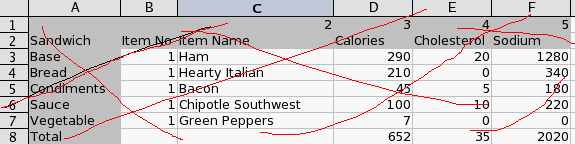
- [3 points] Copy your entire table to A10-F16, (Don't copy row1)
- Change the values in column B of the new table to be 2 2 4 3 5
- Graphs and Charts
- [5 points] Insert a 3-D pie chart showing the contribution of Calories to the sandwich from each component part.
- You should show the component name and the percentage contribution.
- You should put a title on your chart.
- [5 points] Create a 2-D clustered column chart showing the items on the x axis, and the nutritional information within each item.
- Financial functions
- Create a third worksheet, call this one Financial Functions
- [5 points] Construct a table showing the monthly payment on a house costing $125,000 financed for 15, 20, 25 and 30 years, at interest rates of 5%, 6% and 7%.
- [5 points] Compute the Future value of an investment $500, paid quarterly for 20 years at 6% annual interest.
- mail the final product to dbennett@edinboro.edu.